Swish method: differential expression accounting for inferential uncertainty
swish.RdThe Swish method, or "SAMseq With Inferential Samples Helps".
Performs non-parametric inference on rows of y for
various experimental designs. See References for details.
swish(
  y,
  x,
  cov = NULL,
  pair = NULL,
  interaction = FALSE,
  cor = c("none", "spearman", "pearson"),
  nperms = 100,
  estPi0 = FALSE,
  qvaluePkg = "qvalue",
  pc = 5,
  nRandomPairs = 30,
  fast = NULL,
  returnNulls = FALSE,
  quiet = FALSE
)
Arguments
- y
a SummarizedExperiment containing the inferential replicate matrices of median-ratio-scaled TPM as assays 'infRep1', 'infRep2', etc.
- x
the name of the condition variable. A factor with two levels for a two group analysis (possible to adjust for covariate or matched samples, see next two arguments). The log fold change is computed as non-reference level over reference level (see vignette: 'Note on factor levels')
- cov
the name of the covariate for adjustment. If provided a stratified Wilcoxon in performed. Cannot be used with
pair, unless using eitherinteractionorcor- pair
the name of the pair variable, which should be the number of the pair. Can be an integer or factor. If specified, a signed rank test is used to build the statistic by default. Note: For simple paired designs, see use of
fast=1for a much faster implementation of paired testing using a one-sample z-score test statistic. All samples acrossxmust be pairs if this argument is specified. Cannot be used withcov, unless using eitherinteractionorcor- interaction
logical, whether to perform a test of an interaction between
xandcov. Can usepairor not. See Details.- cor
character, whether to compute correlation of
xwith the log counts, and signifance testing on the correlation as a test statistic. Either"spearman"or"pearson"correlations can be computed. For Spearman the correlation is computed over ranks ofxand ranks of inferential replicates. For Pearson, the correlation is computed forxand log2 of the inferential replicates pluspc. Default is"none", e.g. two-group comparison using the rank sum test or other alternatives listed above. Additionally, correlation can be computed between a continuous variablecovand log fold changes acrossxmatched bypair- nperms
the number of permutations. if set above the possible number of permutations, the function will print a message that the value is set to the maximum number of permutations possible
- estPi0
logical, whether to estimate pi0
- qvaluePkg
character, which package to use for q-value estimation,
samrorqvalue- pc
pseudocount for finite estimation of
log2FC, not used in calculation of test statistics,locfdrorqvalue- nRandomPairs
the number of random pseudo-pairs (only used with
interaction=TRUEand un-matched samples) to use to calculate the test statistic- fast
an integer (0 or 1), toggles different methods based on speed, currently only relevant for simple paired analysis. For simple paired design,
fast=1triggers the use of a one-sample z-score instead of a signed rank statistic. The one-sample z-score is much faster (can be >10x faster), by avoiding the expensive re-computation of ranks during permutations.fast=1is not relevant forinteractionorcortype designs- returnNulls
logical, only return the
statvector, thelog2FCvector, and thenullsmatrix (default FALSE)- quiet
display no messages
Value
a SummarizedExperiment with metadata columns added:
the statistic (either a centered Wilcoxon Mann-Whitney
or a signed rank statistic, aggregated over inferential replicates),
a log2 fold change (the median over inferential replicates,
and averaged over pairs or groups (if groups, weighted by sample size),
the local FDR and q-value, as estimated by the samr package.
Details
interaction:
The interaction tests are different than the
other tests produced by swish, in that they focus on a difference
in the log2 fold change across levels of x when comparing
the two levels in cov. If pair is specified, this
will perform a Wilcoxon rank sum test on the two groups
of matched sample LFCs. If pair is not included, multiple
random pairs of samples within the two groups are chosen,
and again a Wilcoxon rank sum test compared the LFCs across groups.
References
The citation for swish method is:
Anqi Zhu, Avi Srivastava, Joseph G Ibrahim, Rob Patro, Michael I Love "Nonparametric expression analysis using inferential replicate counts" Nucleic Acids Research (2019). https://doi.org/10.1093/nar/gkz622
The swish method builds upon the SAMseq method,
and extends it by incorporating inferential uncertainty, as well
as providing methods for additional experimental designs (see vignette).
For reference, the publication describing the SAMseq method is:
Jun Li and Robert Tibshirani "Finding consistent patterns: A nonparametric approach for identifying differential expression in RNA-Seq data" Stat Methods Med Res (2013). https://doi.org/10.1177/0962280211428386
Examples
library(SummarizedExperiment)
set.seed(1)
y <- makeSimSwishData()
y <- scaleInfReps(y)
y <- labelKeep(y)
y <- swish(y, x="condition")

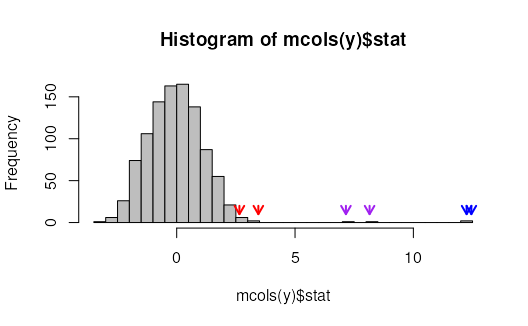
# histogram of the swish statistics
hist(mcols(y)$stat, breaks=40, col="grey")
cols = rep(c("blue","purple","red"),each=2)
for (i in 1:6) {
  arrows(mcols(y)$stat[i], 20,
         mcols(y)$stat[i], 10,
         col=cols[i], length=.1, lwd=2)
}


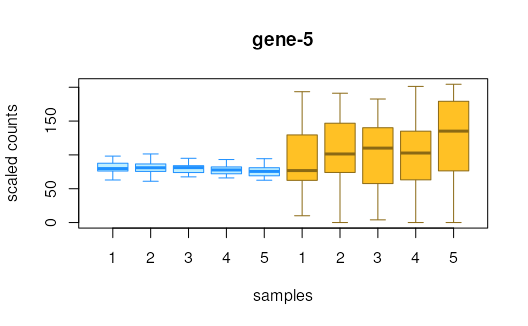
# plot inferential replicates
plotInfReps(y, 1, "condition")

plotInfReps(y, 3, "condition")

plotInfReps(y, 5, "condition")
