About
MRLocus is a statistical method providing Mendelian Randomization analysis per locus, leveraging eQTL and GWAS summary statistics, for estimation of gene-to-trait effect size and dispersion.
See Get started tab for software vignette, and Reference tab for manual pages of the individual functions.
Publication
Anqi Zhu*, Nana Matoba*, Emma P. Wilson, Amanda L. Tapia, Yun Li, Joseph G. Ibrahim, Jason L. Stein, Michael I. Love. “MRLocus: identifying causal genes mediating a trait through Bayesian estimation of allelic heterogeneity” PLOS Genetics, 17(4): e1009455 (2021). doi: 10.1371/journal.pgen.1009455
* Both authors contributed equally to this work.
Data input
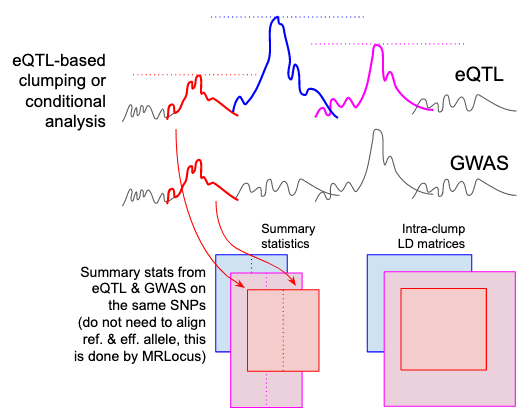
MRLocus uses multiple, distinct eQTL signals in order to perform Mendelian Randomization investigating the effect of gene expression on a downstream GWAS trait. It takes as input the output of a clumping procedure, such as PLINK clump, or ideally, conditional analysis of the eQTL dataset. In the MRLocus paper, we use the PLINK clump settings, --clump-p1 0.001 --clump-p2 1 --clump-r2 0.1 --clump-kb 500, where p1 refers to the eQTL summary associations. MRLocus can then be run on loci that contain more than one clump.

Diagram of input data, also described below
MRLocus then requires:
- Summary statistics for each clump
- Intra-clump LD matrices
Summary statistics for both eQTL and GWAS (effect size, standard error, reference allele, effect allele) of the SNPs in each clump or conditionally distinct cluster should be gathered into tables, making sure the index eSNP is also included. The eQTL and GWAS studies can have different coding of reference and effect alleles, MRLocus has a function that will deal with this internally, to avoid users having to flip alleles and effect sizes themselves.
After having prepared these multiple tables for each clump, they should be read into R as a list of data.frame. The LD matrices for each clump likewise should be read in as a list of matrices (in the same order as the summary statistics list). These lists can be read in with code such as:
sum_stat <- lapply(sum_stat_files, read.delim)
ld_mat <- lapply(ld_mat_files, function(f) as.matrix(read.table(f)))
The steps following reading in the summary statistics and LD matrices into R are described in the vignette under the Get started tab above.
Finally, we note that MRLocus offers its own colocalization model, or alternatively, MRLocus slope fitting can be run after performing eCAVIAR colocalization on the SNPs within each clump. The alternative steps used in the case of eCAVIAR colocalization are discussed in the vignette under Get started tab.
Installation
The mrlocus R package can be installed using devtools. Note that mrlocus uses RStan, and so involves compilation of C++ code. Installation will take longer than with R packages not containing code to be compiled.
library(devtools)
install_github("thelovelab/mrlocus")
Issues
For bug reports, feature requests, or questions, please post here.