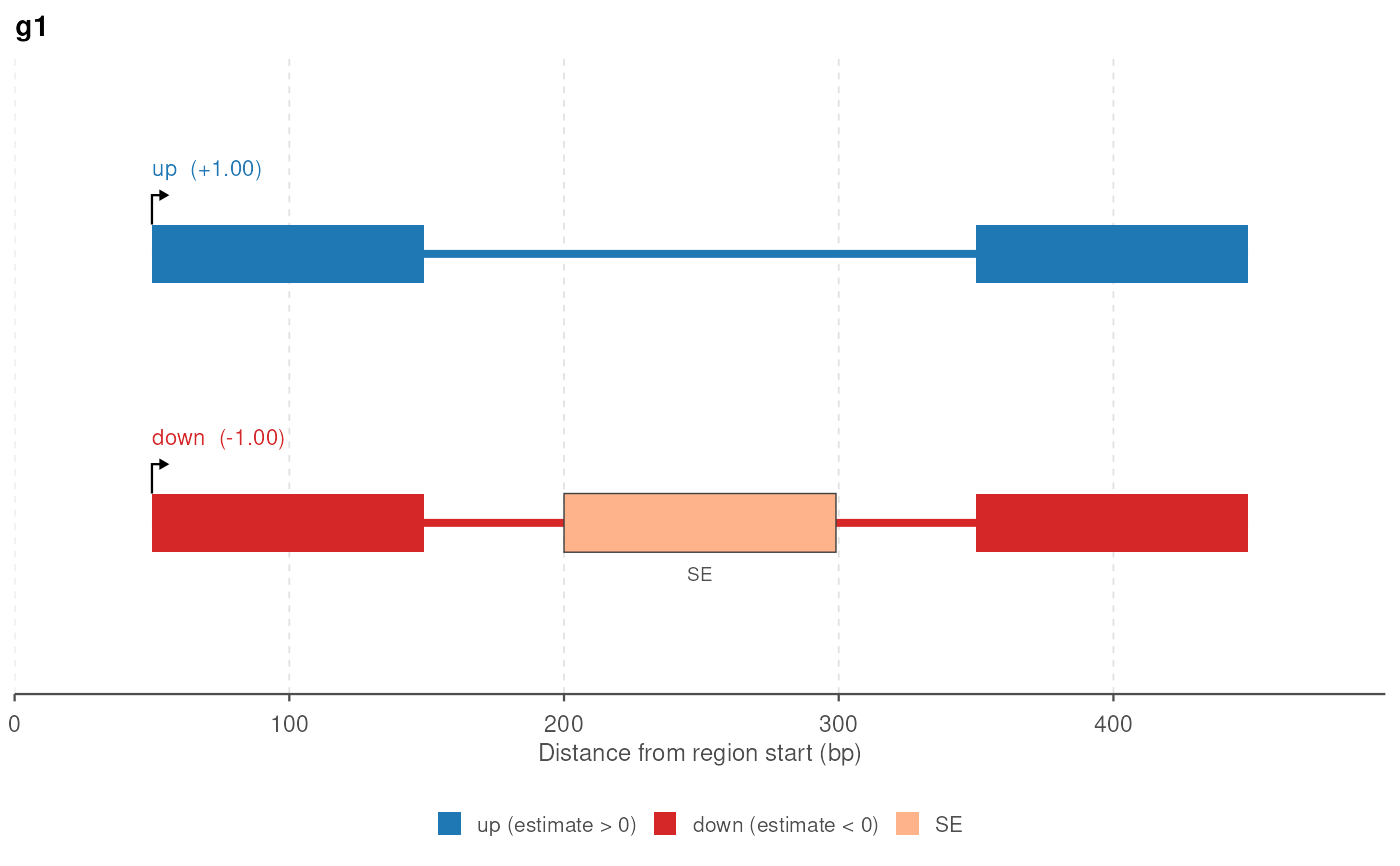
Plot the transcripts involved in splicelogic events, one plot per gene
Source:R/plot_events.R
plot_transcripts_by_gene.RdSplits events by gene_id and draws each gene with
plot_transcripts().
Arguments
- events
A GRanges returned by
find_all_events()or anyfind_*()function, with agene_idcolumn.- exons
A flat GRanges of exons with a
tx_idcolumn holding every transcript inevents, e.g. the preprocessed GRanges the events were found in.- genes
Optional character vector of gene ids to restrict to.
- title
Optional prefix for the plot titles, which are otherwise the gene id.
- ...
Passed to
plot_transcripts().
Examples
exons <- data.frame(
  seqnames = "chr1",
  start = c(1, 201, 401, 1, 401),
  end = c(100, 300, 500, 100, 500),
  strand = "+",
  gene_id = "g1",
  tx_id = c("down", "down", "down", "up", "up"),
  exon_rank = c(1, 2, 3, 1, 2),
  estimate = c(-1, -1, -1, 1, 1)
) |>
  plyranges::as_granges() |>
  preprocess(coef_col = "estimate")

events <- find_all_events(exons, verbose = FALSE)

if (requireNamespace("ggplot2", quietly = TRUE)) {
  plots <- plot_transcripts_by_gene(events, exons)
  plots[["g1"]]
}