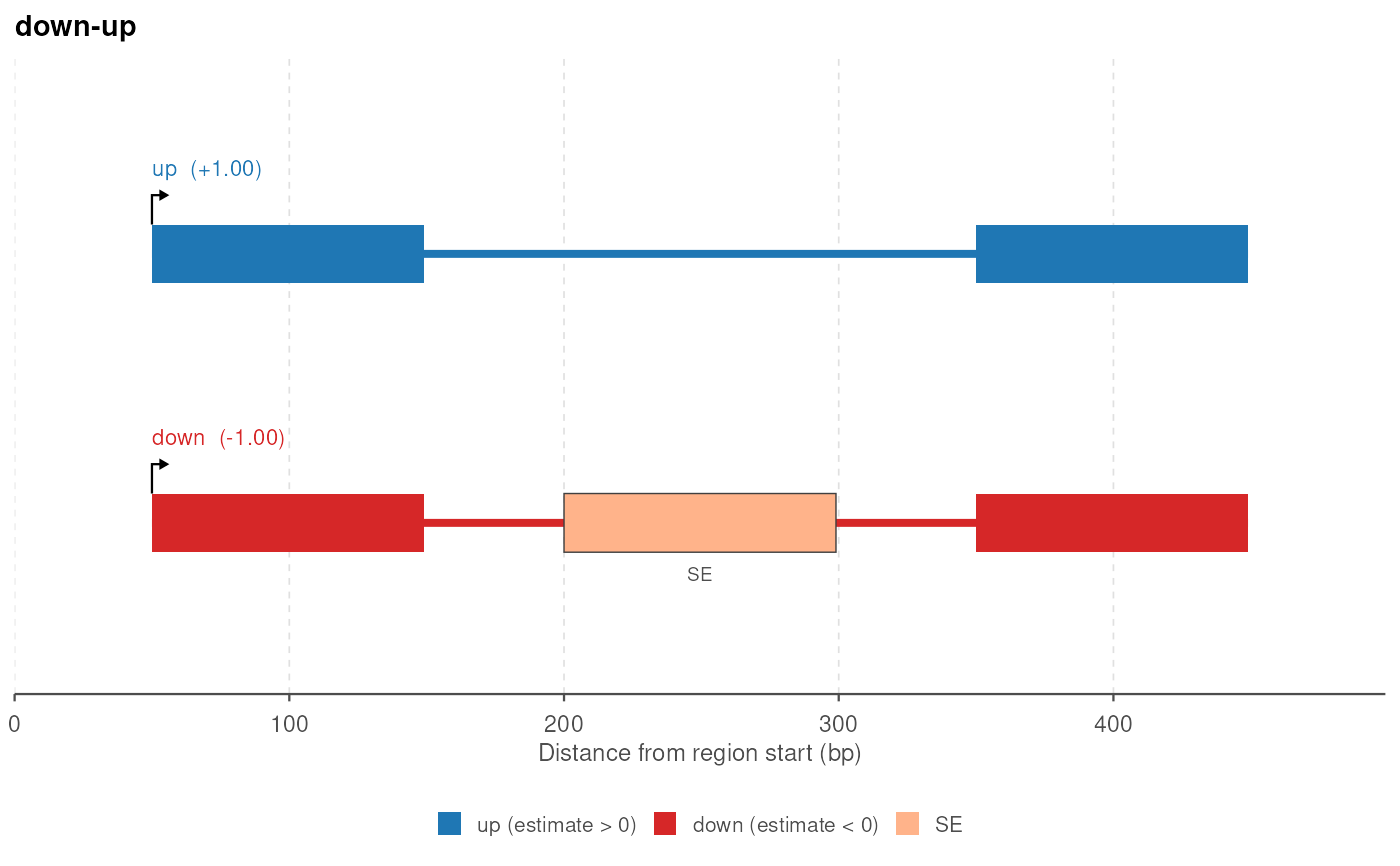
Plot the transcripts involved in splicelogic events, one plot per pair
Source:R/plot_events.R
plot_transcripts_by_pair.RdSplits events by transcript pair, so each plot shows two transcripts and
every event between them. The pair is unordered, so events reported from
either side land in the same plot.
Arguments
- events
A GRanges returned by
find_all_events()or anyfind_*()function. Atx_paircolumn, if present, is used as the grouping as is.- exons
A flat GRanges of exons with a
tx_idcolumn holding every transcript inevents, e.g. the preprocessed GRanges the events were found in.- title
Optional prefix for the plot titles, which are otherwise the transcript pair.
- ...
Passed to
plot_transcripts().
Examples
exons <- data.frame(
  seqnames = "chr1",
  start = c(1, 201, 401, 1, 401),
  end = c(100, 300, 500, 100, 500),
  strand = "+",
  gene_id = "g1",
  tx_id = c("down", "down", "down", "up", "up"),
  exon_rank = c(1, 2, 3, 1, 2),
  estimate = c(-1, -1, -1, 1, 1)
) |>
  plyranges::as_granges() |>
  preprocess(coef_col = "estimate")

events <- find_all_events(exons, verbose = FALSE)

if (requireNamespace("ggplot2", quietly = TRUE)) {
  plots <- plot_transcripts_by_pair(events, exons)
  plots[["down-up"]]
}